The data, 500 Cities: Binge drinking among adults aged >= 18, is from the Center of Disease Control and Prevention (CDC), which is a United States federal agency within Health and Human Services. It specifically represents the percentage of adults that partake in binge drinking in 500 US cities. While it is a study of 500 cities, there are more than just 500 unique identifiers in the data. This is because, each city is divided into a more specific Census Tract if relevant, so there could be multiple rows representing different parts of the same city, however there will not be any overlap in boundries. There are over 28,000 unique areas in the data. The sources of data used were based on government data collection methods, including the Behavioral Risk Factor Surveillance System in 2017, 2010 Census, and American Community Survey 2013-2017 estimates. This data specifically uses the Behavorial Risk Factor Surveillance System. Each of these estimates are federally funded projects used to gather data on the US population. Specifically, these use exact measures for locations that can be uniform and therefore combined to form the dataset. Each method of collection occurs at a relatively frequent basis. The specific project for the data is the 500 Cities project in 2017. The binge drinking data is just a subset of this larger dataset that was compiled by the CDC. The data provides estimates for crude or age-adjusted percentage of adults that partake in binge drinking. The percentage is based on the locality population size. The data is not updated until a more recent study is performed.
The data is in tabular form, where each row’s unique identifier is the Unique Id, which is the census level region. Other columns include geographic columns like State, City, type of geological indicator (City or Tract), and GeoLocation. Many columns are not useful since it a subset of a larger dataset. These include Year, DataSource, Category, as well as some others. These are all the same for all rows as it was the way they could be filtered from the original data. For example, the year for all the data is 2017. The main column of data that will be the focus is the DataValue column. This is the percent of the population that partakes in binge drinking. The Data_Value_Type column indicates where the data value is the crude prevalence or age adjusted prevalence. The crude prevalence is used in most of the rows. The prevalence confidence interval is also given as it is an estimate. The population for each area is also available in the data set. There are 29,006 rows. There are 24 columns, yet about half will be removed due to repeated information. There is a column that notes that the data is suppressed for the prevalence due to the population being too small to make an estimate. The dataset was combined with a simple dataset that mapped the states to a region by the Census. Additionally, we added a dataset that had the ages for each states and this came directly from the Census. We averaged the age groups based on the population provided to get the average age for each state. We merged these values into our dataset.
The research plan is to visualize the prevalence of binge drinking. To do this, geographical data can be used for this visualization. Prevalence of adults that binge drink will be the target variable on the visualizations. Since there is a large amount of geographical data, including mapping of the prevalence can be done. A map colored with a continuous color pallet based on prevalence of binge drinking would be an important visualization to identify nationwide trends. This map will be done on the statewide level. The data is able to create these maps because geographic data is present. This will allow the research and exploration to be completed in a mapping format. Additionally, trends on a larger scale can be done by categorizing each place as a one of the four regions in the US (West, Midwest, Northeast, South) and plotting different visuals like bar charts, histograms, and boxplots. Age and population data will be combined and summarized for each state. These values are to be compared with the state prevalence of binge drinking. Our interactive competents will incorporate a scatterplot for each of these. Therefore,heatmaps and density contour lines can be used to analyze the relationship between these variables.
2.3 Missing value analysis
Code
library(dplyr)
Attaching package: 'dplyr'
The following objects are masked from 'package:stats':

    filter, lag
The following objects are masked from 'package:base':

    intersect, setdiff, setequal, union
Code
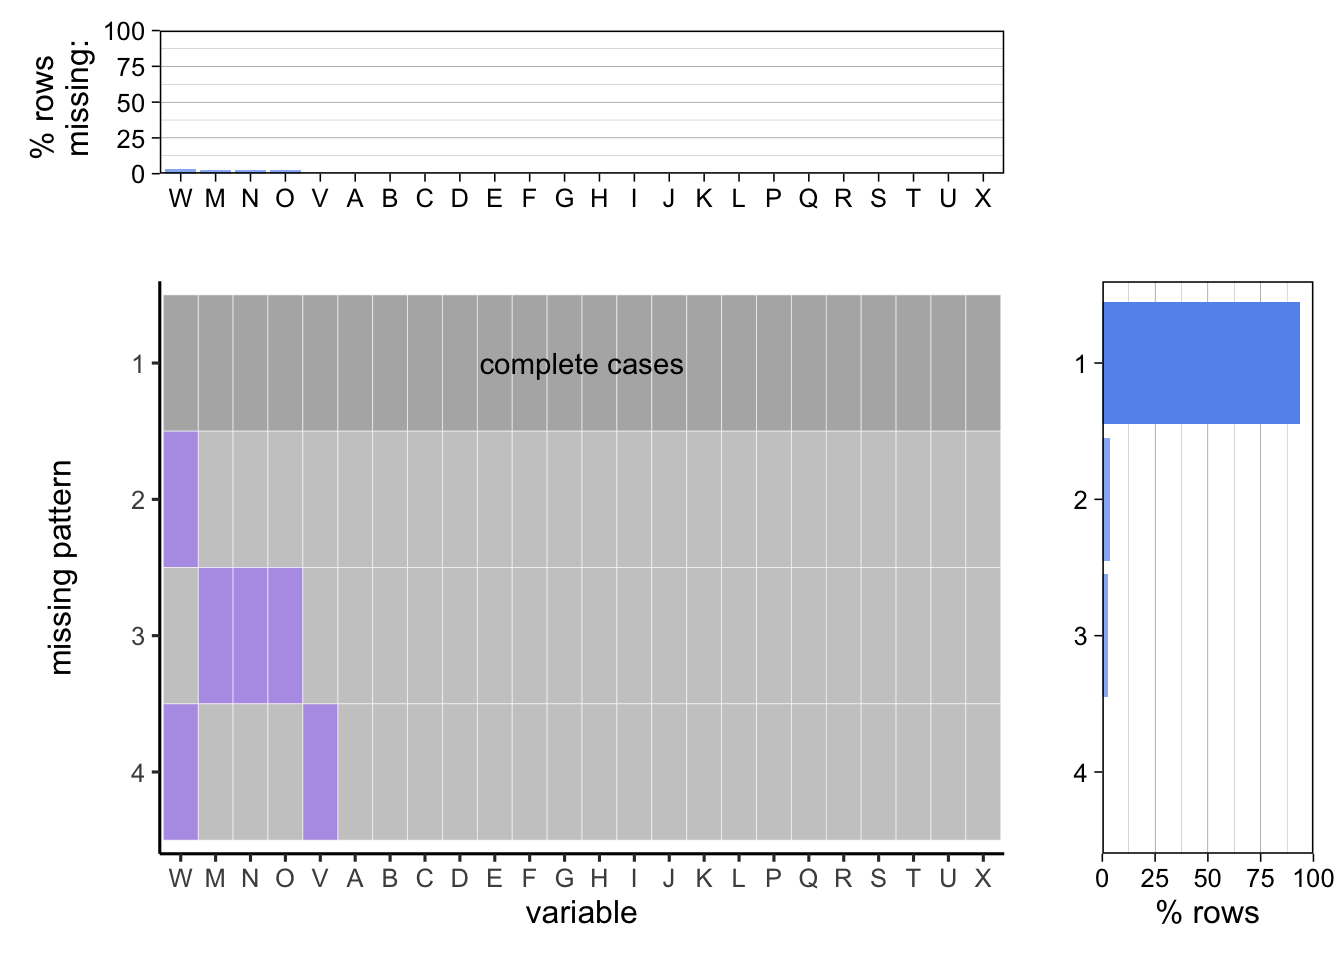
library(redav)drink =read.csv('500_Cities__Binge_drinking_among_adults_aged___18_years.csv')#renaming columns to Lettersdrink_rename <- drink |>rename('A'=Year,'B'=StateAbbr,'C'=StateDesc,'D'=CityName,'E'=GeographicLevel,'F'=DataSource,'G'=Category,'H'=UniqueID,'I'=Measure,'J'=Data_Value_Unit,'K'=DataValueTypeID,'L'=Data_Value_Type,'M'=Data_Value,'N'=Low_Confidence_Limit,'O'=High_Confidence_Limit,'P'=Data_Value_Footnote_Symbol,'Q'=Data_Value_Footnote,'R'=PopulationCount,'S'=GeoLocation,'T'=CategoryID,'U'=MeasureId,'V'=CityFIPS,'W'=TractFIPS,'X'=Short_Question_Text)plot_missing(drink_rename)
Scale for y is already present.
Adding another scale for y, which will replace the existing scale.
Scale for y is already present.
Adding another scale for y, which will replace the existing scale.
Missing values exist in the data set and are in 3 main patterns. Tract FIPS and City FIPS are missing together in rare occasions and Tract FIPS is missing in a small percent of rows. Data value and their respective confidicent intervals are missing together.
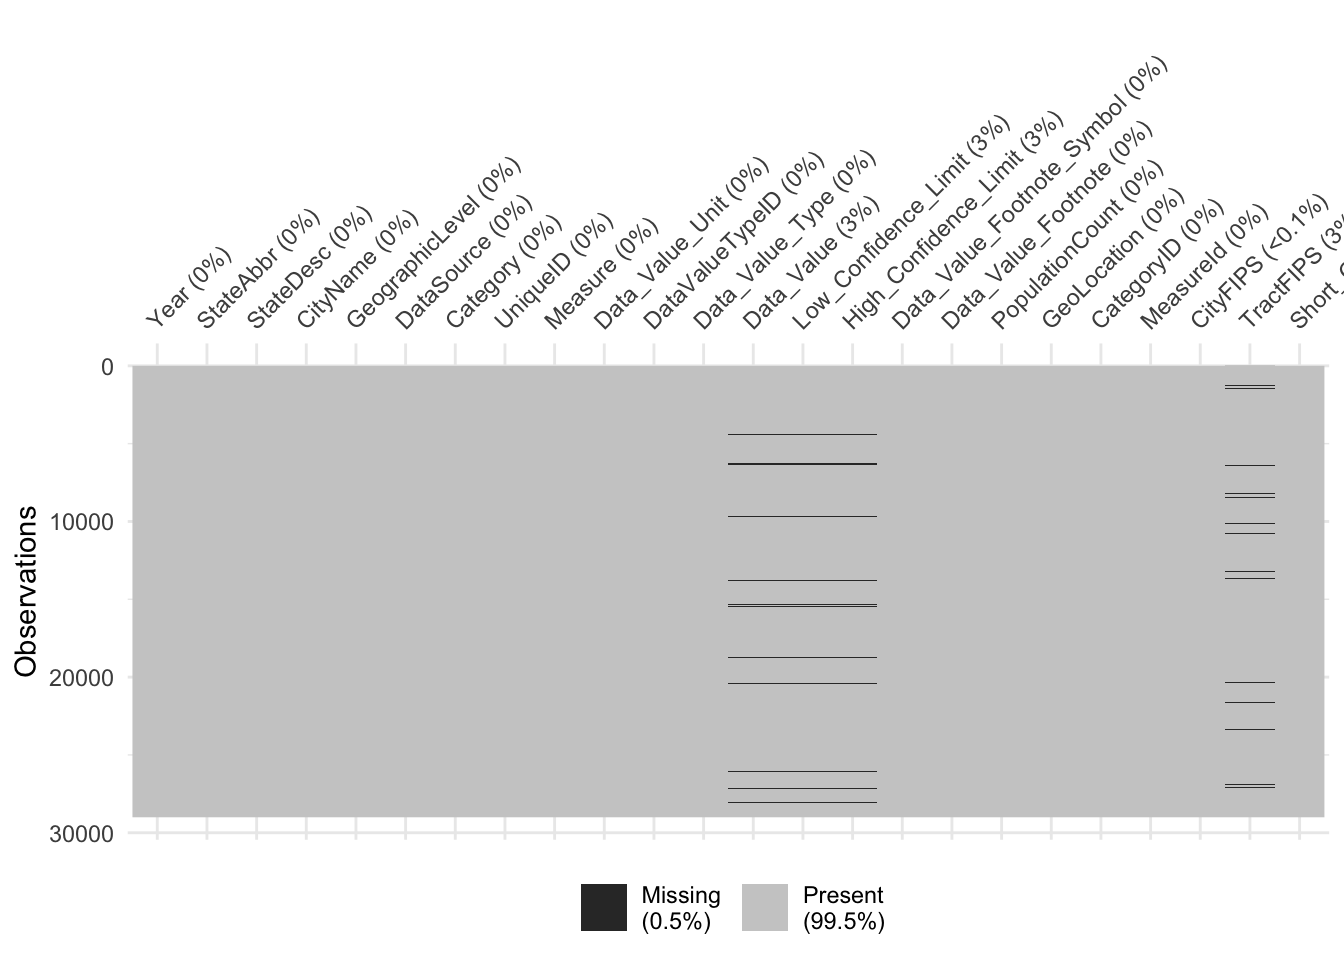
Similar trends can be seen when looking at a heatmap of the missng values in the dataset.
Code
library(ggplot2)library(naniar)vis_miss(drink)
We can see that for 3% of the data, we have missing values for the binge drinking percentage alongside their respective confidence intervals. Sub-setting the data shows us the reason.
  Year StateAbbr     StateDesc   CityName GeographicLevel DataSource
1 2017        NC North Carolin Greensboro    Census Tract      BRFSS
2 2017        AL       Alabama Huntsville    Census Tract      BRFSS
3 2017        AL       Alabama Tuscaloosa    Census Tract      BRFSS
4 2017        AL       Alabama Tuscaloosa    Census Tract      BRFSS
5 2017        AZ       Arizona    Gilbert    Census Tract      BRFSS
6 2017        AZ       Arizona   Avondale    Census Tract      BRFSS
             Category            UniqueID
1 Unhealthy Behaviors 3728000-37081015600
2 Unhealthy Behaviors 0137000-01089011100
3 Unhealthy Behaviors 0177256-01125010103
4 Unhealthy Behaviors 0177256-01125012503
5 Unhealthy Behaviors 0427400-04013422638
6 Unhealthy Behaviors 0404720-04013723304
                                      Measure Data_Value_Unit DataValueTypeID
1 Binge drinking among adults aged >=18 Years               %          CrdPrv
2 Binge drinking among adults aged >=18 Years               %          CrdPrv
3 Binge drinking among adults aged >=18 Years               %          CrdPrv
4 Binge drinking among adults aged >=18 Years               %          CrdPrv
5 Binge drinking among adults aged >=18 Years               %          CrdPrv
6 Binge drinking among adults aged >=18 Years               %          CrdPrv
   Data_Value_Type Data_Value Low_Confidence_Limit High_Confidence_Limit
1 Crude prevalence         NA                   NA                    NA
2 Crude prevalence         NA                   NA                    NA
3 Crude prevalence         NA                   NA                    NA
4 Crude prevalence         NA                   NA                    NA
5 Crude prevalence         NA                   NA                    NA
6 Crude prevalence         NA                   NA                    NA
  Data_Value_Footnote_Symbol                              Data_Value_Footnote
1                          * Estimates suppressed for population less than 50
2                          * Estimates suppressed for population less than 50
3                          * Estimates suppressed for population less than 50
4                          * Estimates suppressed for population less than 50
5                          * Estimates suppressed for population less than 50
6                          * Estimates suppressed for population less than 50
  PopulationCount                     GeoLocation CategoryID MeasureId CityFIPS
1               1 (36.1909973664, -79.7508893589)     UNHBEH     BINGE  3728000
2               4  (34.678659986, -86.6942482318)     UNHBEH     BINGE   137000
3              13 (33.4037171009, -87.5950158306)     UNHBEH     BINGE   177256
4               5 (33.1448113269, -87.5293125395)     UNHBEH     BINGE   177256
5               4 (33.3818684313, -111.716815189)     UNHBEH     BINGE   427400
6              13 (33.3198366954, -112.330920794)     UNHBEH     BINGE   404720
    TractFIPS Short_Question_Text
1 37081015600      Binge Drinking
2  1089011100      Binge Drinking
3  1125010103      Binge Drinking
4  1125012503      Binge Drinking
5  4013422638      Binge Drinking
6  4013723304      Binge Drinking
We can see that every single element that has missing values in the data value has “Estimates suppressed for population less than 50” in its footnote, making the missingness type MAR, since it depends on the population count column.
A similar trend arises for the TractFIPS column.
Code
x = drink %>%filter(is.na(TractFIPS))head(x)
  Year StateAbbr  StateDesc  CityName GeographicLevel DataSource
1 2017        CA California     Indio            City      BRFSS
2 2017        CA California   Antioch            City      BRFSS
3 2017        CA California     Chino            City      BRFSS
4 2017        CA California Fullerton            City      BRFSS
5 2017        CA California    Merced            City      BRFSS
6 2017        CA California    Orange            City      BRFSS
             Category UniqueID                                     Measure
1 Unhealthy Behaviors  0636448 Binge drinking among adults aged >=18 Years
2 Unhealthy Behaviors  0602252 Binge drinking among adults aged >=18 Years
3 Unhealthy Behaviors  0613210 Binge drinking among adults aged >=18 Years
4 Unhealthy Behaviors  0628000 Binge drinking among adults aged >=18 Years
5 Unhealthy Behaviors  0646898 Binge drinking among adults aged >=18 Years
6 Unhealthy Behaviors  0653980 Binge drinking among adults aged >=18 Years
  Data_Value_Unit DataValueTypeID         Data_Value_Type Data_Value
1               %       AgeAdjPrv Age-adjusted prevalence       17.7
2               %          CrdPrv        Crude prevalence       18.4
3               %          CrdPrv        Crude prevalence       19.8
4               %       AgeAdjPrv Age-adjusted prevalence       18.4
5               %          CrdPrv        Crude prevalence       17.0
6               %          CrdPrv        Crude prevalence       21.0
  Low_Confidence_Limit High_Confidence_Limit Data_Value_Footnote_Symbol
1                 17.5                  17.9
2                 18.3                  18.5
3                 19.6                  20.0
4                 18.3                  18.5
5                 16.8                  17.2
6                 20.8                  21.1
  Data_Value_Footnote PopulationCount                     GeoLocation
1                               76036 (33.7298067837, -116.237258141)
2                              102372 (37.9777042922, -121.796606971)
3                               77983  (33.983588126, -117.665296584)
4                              135161 (33.8840378013, -117.927850895)
5                               78958 (37.3055863217, -120.477710571)
6                              136416   (33.8046419567, -117.8231855)
  CategoryID MeasureId CityFIPS TractFIPS Short_Question_Text
1     UNHBEH     BINGE   636448        NA      Binge Drinking
2     UNHBEH     BINGE   602252        NA      Binge Drinking
3     UNHBEH     BINGE   613210        NA      Binge Drinking
4     UNHBEH     BINGE   628000        NA      Binge Drinking
5     UNHBEH     BINGE   646898        NA      Binge Drinking
6     UNHBEH     BINGE   653980        NA      Binge Drinking
Here we can also see that all the missing data corresponds to cities instead of census tracts, with the addition of two entries for the whole of the United States.